
 Shadow Hills Market at a Glance: A Comparative Analysis of August 11 and July 11 Stats
We’re back with another insightful update on the ever-evolving real estate landscape in Shadow Hills, California. In this edition, we’ll provide you with a detailed breakdown of the market’s performance during the months of August and July, allowing you to spot the trends and shifts that have shaped the local housing market.
August 11th Stats:
Let’s kick things off by examining the latest statistics for the Shadow Hills real estate market as of August 11:
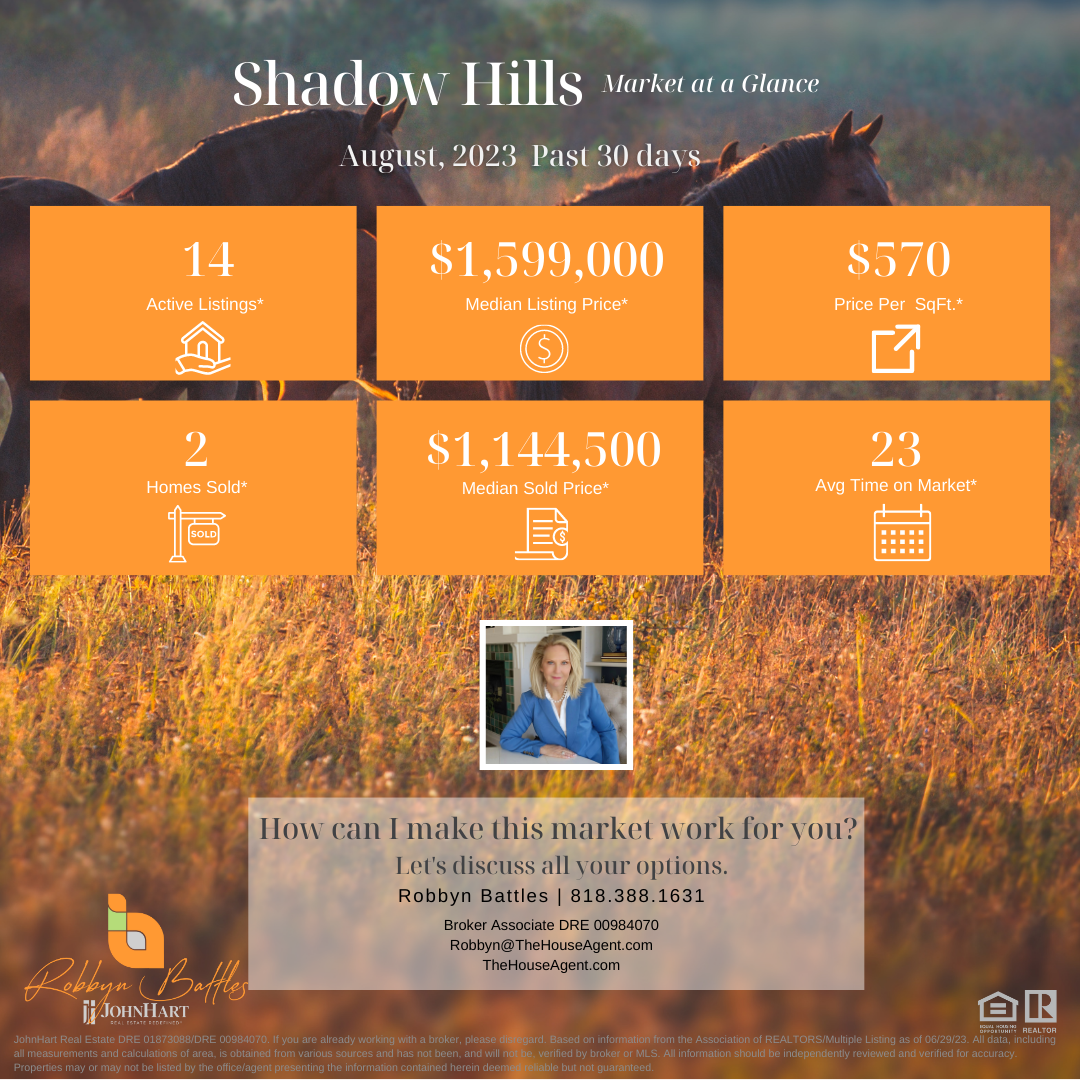
- Homes for Sale: The market has seen a recent expansion, with 14 homes currently available for purchase. This increase in inventory provides potential buyers with a broader range of options to explore.
- Median List Price: The median list price has experienced a moderate rise, reaching $1,599,000. This uptick could indicate a growing demand for higher-end properties in the area.
- Average Price per Square Foot: The average price per square foot has also shifted upward, now at $570. This suggests a potential adjustment in property valuations and buyer expectations.
- Closed Sales: Over the last 30 days, the market has witnessed 2 closed sales. While this number is lower than in previous months, it underscores the ongoing activity within the market.
- Median Sale Price: The median sale price for August has decreased to $1,144,500. This fluctuation could be influenced by various factors, including the types of properties sold and the preferences of buyers.
- Average Market Time: Properties are taking slightly longer to sell, with the average market time increasing to 23 days. This change in pace may indicate a shift in buyer behavior or market dynamics.
July 11th Stats:
Now, let’s rewind to the statistics recorded on July 11 to gain a comprehensive view of the market’s recent history:
- Homes for Sale: In July, the market featured 10 homes available for purchase, indicating a potential increase in inventory since then.
- Median List Price: The median list price for July stood at $1,589,500, reflecting a notable increase by the time August arrived.
- Average Price per Square Foot: The average price per square foot was slightly lower in July, at $520, suggesting a potential price adjustment or market shift in the following month.
- Closed Sales: During the 30 days leading up to July 11, there were 4 closed sales, showcasing a higher rate of activity compared to August.
- Median Sale Price: July’s median sale price was $1,206,500, which was higher than the median sale price recorded for August.
- Average Market Time: Properties were selling at a faster pace in July, with an average market time of just 14 days, compared to the slightly longer time recorded in August.
Comparative Analysis:
A careful analysis of these two months reveals intriguing insights into the Shadow Hills real estate market. The increase in inventory, coupled with the rise in both median list price and average price per square foot, suggests a market that is still vibrant and sought-after. However, August’s decline in closed sales and median sale price indicates potential shifts in buyer preferences or external influences impacting buyer decisions.
The extension of the average market time for closed sales could point toward a market that is gradually balancing out, providing buyers with more time to make decisions and potentially fostering a more negotiable environment.
As we conclude this analysis, it’s clear that the real estate market in Shadow Hills is in a state of flux, influenced by various factors that shape buyer behavior and market conditions. Staying informed about these fluctuations can empower both buyers and sellers to make well-informed decisions in this ever-changing landscape. The journey of the Shadow Hills real estate market continues, and we’ll be here to provide you with the latest updates as it unfolds.